Table 1.
PCR primers. PCR primers for human detrusor sample were designed by using the conserved sequences between humans and mice. (p), (h) (m) represent pig, human and mouse, respectively.
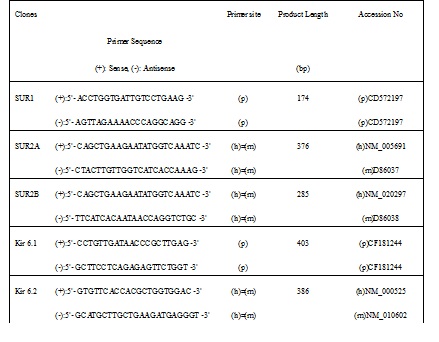
The reaction condition
The reaction condition was:
1) in Kir6.1, after 95oC for 3 min., 35 cycles of 95oC for 35 sec, 58oC for 35 sec and 72oC for 40 sec
2) in Kir6.2, after 95oC for 3 min., 35 cycles of 95oC for 35 sec, 61oC for 35 sec and 72oC for 40 sec
3) in SUR2A, after 95oC for 3 min., 3 cycles of 51oC for 40 sec and 72oC for 40 sec, and subsequently 33 cycles of 95oC for 35 sec, 56oC for 35 sec and 72oC for 40 sec
4) in SUR2B, after 95oC for 3 min., 3 cycles of 49oC for 40 sec and 72oC for 40 sec, and subsequently 33 cycles of 95oC for 35 sec, 54oC for 35 sec and 72oC for 40 sec.
Supplementary Methods
The whole-cell current data was low-passed at 1 kHz (-3 dB) by a 3-pole Bessel filter, sampled at 10 ms (continuous traces) or 1 ms (ramp currents) and analyzed on a computer (Macintosh IIci) using the commercial software Mac Lab 3.5.6 (ADInstruments Pty Ltd, Castle Hill, Australia). The traces were illustrated by Kaleidagraph v3.04 (Synergy Software, Reading, PA, USA) or Corel.For the single channel study, current signals were low-pass filtered at 1 kHz and digitized at 5 kHz before being stored on a computer hard disk. The all representative traces of single channel currents filtered at 300 Hz using an 8-pole Bessel filter were made by WinEDR v3.0.0 (kindly provided by Dr John Dempster, Universtiy of Strathclyde, Scotland)and Kaleidagraph v3.04 (Fig. 1, 2, 3 & 4). In the cell-attached patch configuration, single channel currents were induced by 100 mM levcromakalim and inhibited by 10 mM glibenclamide at a holding potential of 0 mV (B).
Since, in the present experiments, we did not define the total number of channels present in each patch membrane, open state probability values [(number of channels x (mean open probability of the single channels): NPo)] were calculated using the following formula:
Channel activity = (a1 + 2a2+...+nan) / (a1 + a2+...+an),
where a1, a2 and an are the areas under each peak of the amplitude histogram with the channel closed, one channel open and simultaneous openings of 2 and n channels, respectively. Single channel amplitudes and channel open times were determined by the free web software WinEDR v.3.0.0. The graphs were obtained from 2 min. recordings. The same analysis procedure was performed in the following results unless otherwise noted.
|